Benchmarks
We compare computation time for a few algorithms implemented in the major machine learning toolkits accessible in Python.
Last Update: June-2011
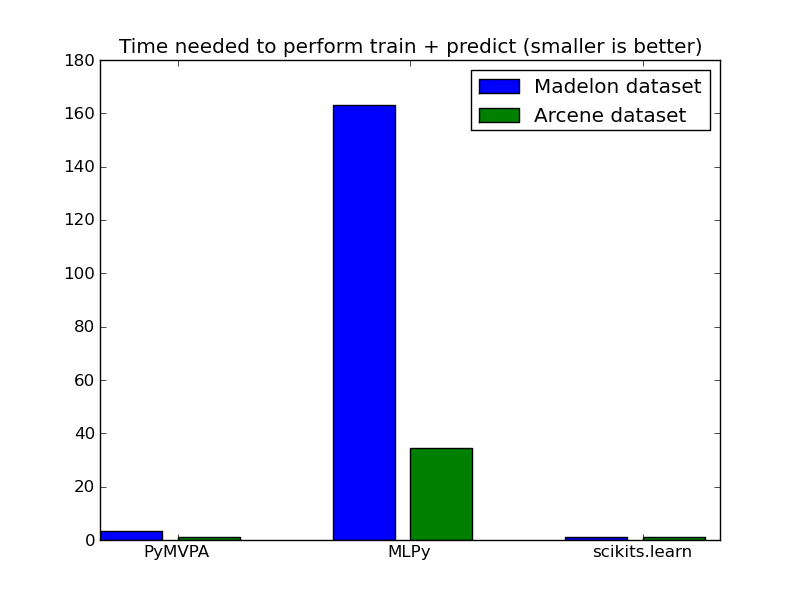
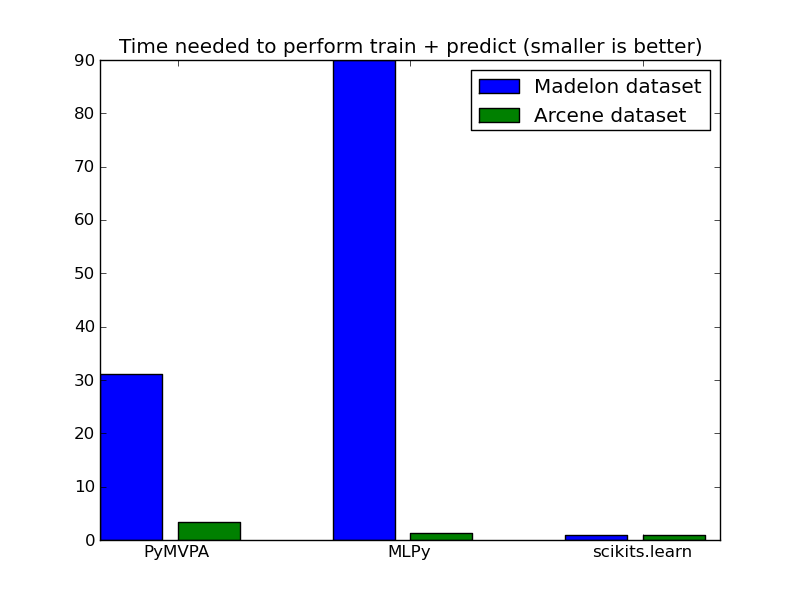
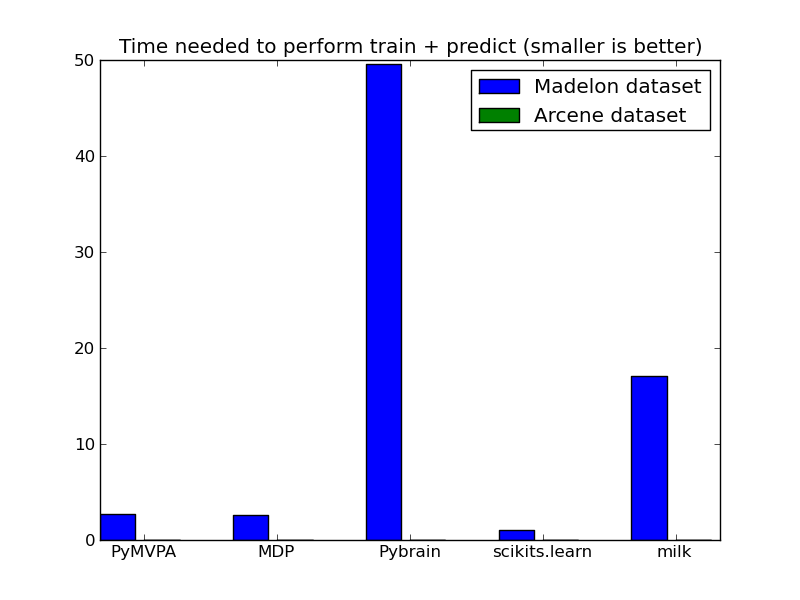
Time in seconds on the Madelon dataset for various machine learning libraries exposed in Python: MLPy, PyBrain, PyMVPA, MDP, Shogun and MiLK. Code for running the benchmarks can be retrieved it’s github repository.
We also print the score on a validation dataset for all algorithms. For classification algorithms, it’s the fraction of correctly classified samples, for regression algorithms it’s the mean squared error and for k-means it’s the inertia criterion.
Used software
We used the latest released version as of June 2011:
- scikits.learn 0.8
- MDP 3.1
- MLPy 2.2.2
- PyMVPA 0.6.0~rc3
- Shogun 0.10.0
I ran it on an Intel Core2 CPU @ 1.86GHz.
Used datasets
We use the Madelong and Arcene data set. The Madelon data set, 4400 instances and 500 attributes, is an artificial dataset, which was part of the NIPS 2003 feature selection challenge. This is a two-class classification problem with continuous input variables. The difficulty is that the problem is multivariate and highly non-linear.
The arcene data set task is to distinguish cancer versus normal patterns from mass-spectrometric data. This is a two-class classification problem with continuous input variables. This dataset is one of 5 datasets of the NIPS 2003 feature selection challenge. All details about the preparation of the data are found in our technical report: Design of experiments for the NIPS 2003 variable selection benchmark, Isabelle Guyon, July 2003.
Support Vector Machines
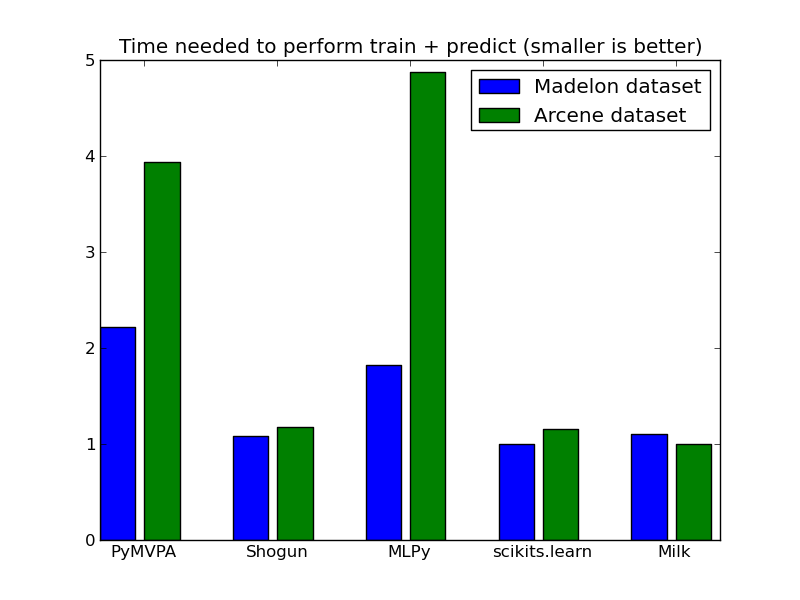
We used several Support Vector Machine (RBF kernel) implementations. Numbers represent the time in seconds (lower is better) it took to train the dataset and perform prediction on a test dataset. In the plot, results are normalized to have the fastest method at 1.0.
| Dataset | PyMVPA | Shogun | MDP | Pybrain | MLPy | scikits.learn | Milk |
|---|---|---|---|---|---|---|---|
| Madelon | 11.52 | 5.63 | 40.48 | 17.5 | 9.47 | 5.20 | 5.76 |
| Arcene | 1.30 | 0.39 | 4.87 | – | 1.61 | 0.38 | 0.33 |
The score by these calssfifiers in in a test dataset is.
| Dataset | PyMVPA | Shogun | MDP | Pybrain | MLPy | scikits.learn | milk |
|---|---|---|---|---|---|---|---|
| Madelon | 0.65 | 0.65 | – | – | 0.65 | 0.65 | 0.50 |
| Arcene | 0.73 | 0.73 | 0.73 | – | 0.73 | 0.73 | 0.73 |
Warning
This is just meant as a sanity check, should not be taken at face value since parameters are not cross-validated, etc.
Nearest neighbors
| Dataset | PyMVPA | Shogun | MDP | MLPy | scikits.learn | milk |
|---|---|---|---|---|---|---|
| Madelon | 0.56 | 1.36 | 0.58 | 1.41 | 0.57 | 8.24 |
| Arcene | 0.10 | 0.22 | 0.10 | 0.21 | 0.09 | 1.33 |
| Dataset | PyMVPA | Shogun | MDP | MLPy | scikits.learn | milk |
|---|---|---|---|---|---|---|
| Madelon | 0.73 | 0.73 | 0.73 | 0.73 | 0.73 | 0.73 |
| Arcene | 0.73 | 0.73 | 0.73 | 0.73 | 0.73 | 0.73 |
K-means
We run the k-means algorithm on both Madelon and Arcene dataset. To make sure the methods are converging, we show in the second table the inertia of all methods, which are mostly equivalent.
Note: The shogun is failling ..
| Dataset | MDP | Shogun | Pybrain | MLPy | scikits.learn | milk |
|---|---|---|---|---|---|---|
| Madelon | 35.75 | 0.68 | NC | 0.79 | 1.34 | 0.67 |
| Arcene | 2.07 | 0.19 | 20.50 | 0.33 | 0.51 | 0.23 |
NC = Not Converging after one hour iteration.
The following table shows the inertia, criterion that the k-means algorithm minimizes.
| Dataset | MDP | Shogun | Pybrain | MLPy | scikits.learn | Milk |
|---|---|---|---|---|---|---|
| Madelon | 7.4x10^8 | 7.3x10^8 | – | 7.3x10^8 | 7.4x10^8 | 7.3x10^8 |
| Arcene | 1.4x10^9 | oo | 1.4x10^9 | 1.4x10^9 | 1.4x10^9 |
Elastic Net
We solve the elastic net using a coordinate descent algorithm on both Madelon and Arcene dataset.
| Dataset | PyMVPA | MLPy | scikits.learn |
|---|---|---|---|
| Madelon | 1.44 | 73.7 | 0.52 |
| Arcene | 2.31 | 65.48 | 1.90 |
| Dataset | PyMVPA | MLPy | scikits.learn |
|---|---|---|---|
| Madelon | 699.1 | 3759.8 | 597.1 |
| Arcene | 84.92 | 151.28 | 65.39 |
Lasso (LARS algorithm)
We solve the Lasso model by Least Angle Regression (LARS) algorithm. MLPy and scikits.learn use a pure Python implementation, while PyMVPA uses bindings to R code.
We also show the Mean Squared error as a sanity check for the model. Note that some NaN arise due to collinearity in the data.
| Dataset | PyMVPA | MLPy | scikits.learn |
|---|---|---|---|
| Madelon | 37.35 | 105.3 | 1.17 |
| Arcene | 11.53 | 3.82 | 2.95 |
| Dataset | PyMVPA | MLPy | scikits.learn |
|---|---|---|---|
| Madelon | 567.0 | 682.32 | 680.91 |
| Arcene | 87.5 | NaN | 65.39 |
Principal Component Analysis
We run principal component analysis on the madelon datasets. In the libraries that support it (scikit-learn, MDP, PyMVPA), we number of components in the projection to 9. For the arcene dataset, most libraries could not handle the memory requirements.
| Dataset | PyMVPA | MDP | Pybrain | scikits.learn | milk |
|---|---|---|---|---|---|
| Madelon | 0.48 | 0.47 | 8.93 | 0.18 | 3.07 |
| Dataset | PyMVPA | MDP | Pybrain | scikits.learn | milk |
|---|---|---|---|---|---|
| Madelon | 136705.5 | 136705.5 | 228941.0 | 135788.2 | 455715.83 |


