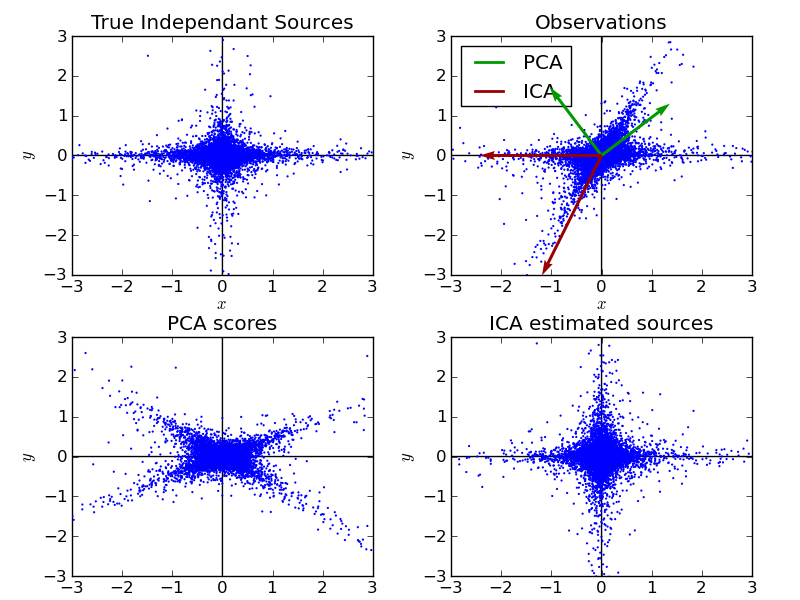
FastICA on 2D point clouds
Illustrate visually the results of ICA vs PCA
Python source code: plot_ica_vs_pca.py
import numpy as np
import pylab as pl

from scikits.learn.pca import PCA
from scikits.learn.fastica import FastICA

###############################################################################
# Generate sample data
S = np.random.standard_t(1.5, size=(2, 10000))
S[0] *= 2.

# Mix data
A = [[1, 1], [0, 2]] # Mixing matrix

X = np.dot(A, S) # Generate observations

pca = PCA()
S_pca_ = pca.fit(X.T).transform(X.T).T

ica = FastICA()
S_ica_ = ica.fit(X).transform(X) # Estimate the sources

S_ica_ /= S_ica_.std(axis=1)[:,np.newaxis]

###############################################################################
# Plot results

def plot_samples(S, axis_list=None):
    pl.scatter(S[0], S[1], s=2, marker='o', linewidths=0, zorder=10)
    if axis_list is not None:
        colors = [(0, 0.6, 0), (0.6, 0, 0)]
        for color, axis in zip(colors, axis_list):
            axis /= axis.std()
            x_axis, y_axis = axis
            # Trick to get legend to work
            pl.plot(0.1*x_axis, 0.1*y_axis, linewidth=2, color=color)
            # pl.quiver(x_axis, y_axis, x_axis, y_axis, zorder=11, width=0.01,
            pl.quiver(0, 0, x_axis, y_axis, zorder=11, width=0.01,
                        scale=6, color=color)

    pl.hlines(0, -3, 3)
    pl.vlines(0, -3, 3)
    pl.xlim(-3, 3)
    pl.ylim(-3, 3)
    pl.xlabel('$x$')
    pl.ylabel('$y$')

pl.close('all')
pl.subplot(2, 2, 1)
plot_samples(S / S.std())
pl.title('True Independant Sources')

axis_list = [pca.components_, ica.get_mixing_matrix()]
pl.subplot(2, 2, 2)
plot_samples(X / np.std(X), axis_list=axis_list)
pl.legend(['PCA', 'ICA'], loc='upper left')
pl.title('Observations')

pl.subplot(2, 2, 3)
plot_samples(S_pca_ / np.std(S_pca_))
pl.title('PCA scores')

pl.subplot(2, 2, 4)
plot_samples(S_ica_ / np.std(S_ica_))
pl.title('ICA estimated sources')

pl.subplots_adjust(0.09, 0.04, 0.94, 0.94, 0.26, 0.26)

pl.show()